Why to monitor lake Balaton?

Lake Balaton and its eutrophication
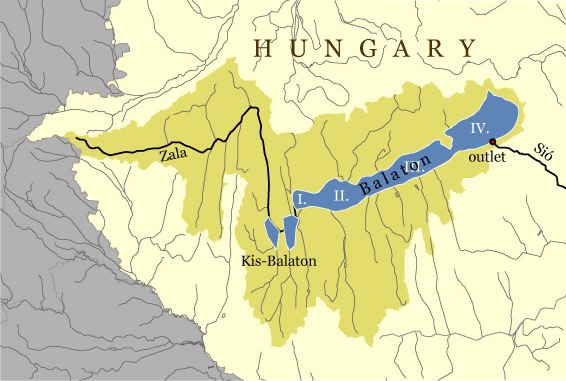
Lake Balaton is a large, shallow lake that can be divided into four consecutive basins. The largest tributary, the Zala River (mean flow at the mouth is 7.8 m3 s-1) drains nearly half of the catchment of the lake into the smallest Basin 1. The only outflow is the Sió Canal that connects Basin 4 with the Danube. The canal and its control gate was constructed in 1863.

| Volume | Mean depth | Surface area (km2) | Areal ratio | ||
|---|---|---|---|---|---|
| 106 m3 | m | lake | catchment | catchment/lake | |
| Basin 1 | 82 | 2.3 | 38 | 2750 | 72 |
| Basin 2 | 413 | 2.9 | 144 | 1647 | 11 |
| Basin 3 | 600 | 3.2 | 186 | 534 | 3 |
| Basin 4 | 802 | 3.7 | 228 | 249 | 1 |
| Lake | 1897 | 3.2 | 596 | 5180 | 9 |
Major socio-economic development took place around the lake and in its catchment after World War II. About half of the catchment became cultivated. The annual average rate of erosion reached 4-6 thousand tons km-2. Between 1950-1975, fertilizer use increased by a factor of 60 resulting in a substantial P accumulation (440 kg ha-1) in the topsoil. More than 40 industrialized animal farms were built. Tourist trade rose by a factor of 14, and the number of permanent inhabitants doubled. Sewerage construction started in the mid-1950s, but only 15% of the utilized water received secondary treatment in 1975. From the late 1960s, P-based detergents have been applied increasingly.
By the 1980s, direct sewage load made up 25% of the biologically available P (BAP) load to the whole lake. Direct sewage accounted for a major part of BAP load in Basins 3 (40%) and 4 (70%) that have small sub-catchments and high exposure to tourism. Tributaries discharged more than 75% of the BAP load to Basins 1 and 2. The Zala River alone transported 20% of the BAP load of the whole lake. Sixty percent of the total P (TP) load (51 tons yr-1) of the river originated from point sources. The largest town in the catchment, Zalaegerszeg (60 thousand inhabitants) emitted 36 tons P yr-1.
| Load (tons P yr-1); 1980-1987 | Lake | Basin 1 | Basin 2 | Basin 3 | Basin 4 | ||
|---|---|---|---|---|---|---|---|
| Tributaries | TP | 190±50 | 97±5 | 65±21 | 25±12 | 13±12 | |
| BAP | 117±20 | 58±1 | 38±9 | 13±5 | 8±5 | ||
| Direct sewage | TP=BAP | 24±5 | 0±0 | 1±0 | 9±2 | 14±3 | |
| Direct runoff | TP | 42±26 | 6±4 | 5±3 | 13±8 | 18±8 | |
| BAP | 12±7 | 2±1 | 1±1 | 4±2 | 5±3 | ||
| Atmospheric | TP(BAP?) | 17±7 | 1±0 | 4±2 | 5±2 | 7±2 | |
| Total load | TP | 284±88 | 104±9 | 75±26 | 52±24 | 52±29 | |
| BAP | 152±32 | 60±2 | 40±10 | 26±9 | 27±11 | ||
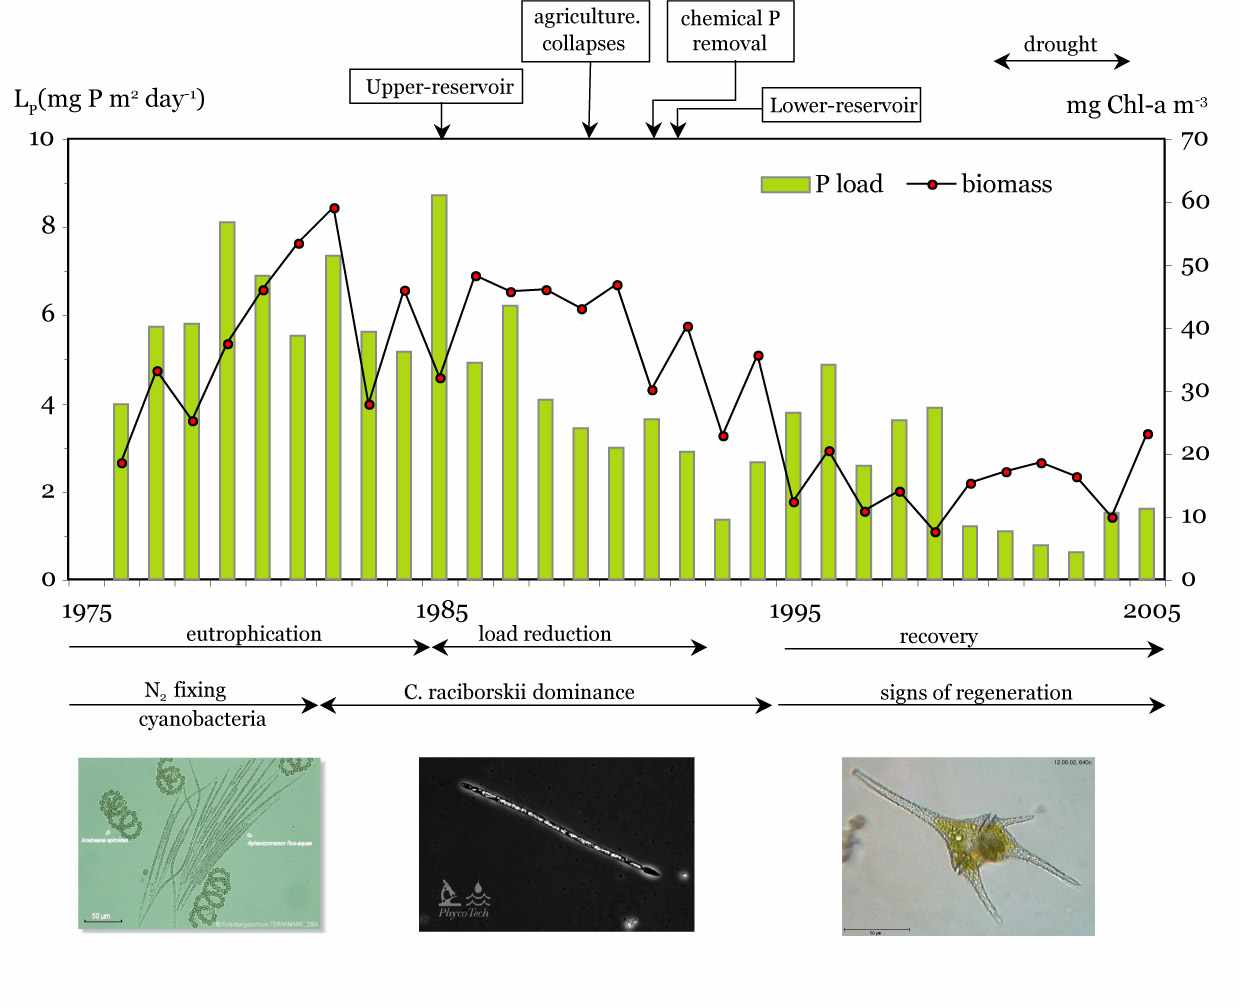
Increased nutrient loads induced rapid eutrophication during the 1970ies. Summer blooms of heterocystic, occasionally toxic cyanobacteria (Aphanizomenon flos-aquae, Anabaena spiroides, Cylindrospermopsis raciborskii) occurred regularly in Basin 1. C. raciborskii invaded the whole lake during hot summers. According to the OECD classification, the southwestern basins became hypertrophic. Although the northeastern basins remained mesotrophic, their water quality also deteriorated.
Eutrophication led to manifold ecological and economic losses. Lake Balaton is an internationally recognized recreational lake but eutrophication challenged its attractiveness. Commercial fishery and angling suffered from increased productivity that shifted the composition of the fish fauna towards less valuable species. Cyanobacterial blooms, repeated fish kills, retreat of the shoreline reed stands, mass emergence of chironomids were symptomes of eutrophication that stirred up the public and urged large-scale management measures.
Management measures and recovery
Point sources were controlled by (i) closing up large-scale animal farms, (ii) sewage diversion from the shoreline settlements of Basins 3 and 4 b, and (iii) introduction of P precipitation at the largest sewage treatment plants of the catchment with an effluent standard of 1.8 mg P m-3. To manage non-point sources, the Kis-Balaton pre-reservoirs were constructed in a former wetland area near the mouth of the Zala River. The Upper Reservoir was inundated in 1985, whereas the Lower Reservoir has not been fully implemented yet. Moreover, the Hungarian agriculture collapsed during the political changes in 1989. Since that time, fertilizer application dropped significantly. Altogether, P load of Lake Balaton has decreased by about 50%.
| TP load (tons P yr-1); 1989-2002 | Lake | Basin 1 | Basin 2 | Basin 3 | Basin 4 | ||
|---|---|---|---|---|---|---|---|
| Geochemical background | 17±6 | 9±3 | 5±2 | 2±1 | 1±0 | ||
| Sewage | 11±3 | 7±2 | 3±1 | 1±0 | 0±0 | ||
| Urban runoff | 34±11 | 9±3 | 12±4 | 6±2 | 7±3 | ||
| Agricultural (rural) runoff | 74±27 | 20±11 | 23±8 | 14±5 | 17±6 | ||
| Atmospheric | 10±5 | 1±0 | 2±1 | 3±2 | 4±2 | ||
| Total | 145±47 | 45±19 | 46±14 | 26±8 | 29±9 | ||
| Through-flow | 18±9 | 21±12 | 15±11 | ||||
Although the lake possesses each unpleasant feature that may hinder eutrophication management—large, shallow lake with a long history of eutrophication, high share of non-point loads, presence of bloom-forming cyanobacteria—the moderate decrease in the P load led to an unexpectedly large improvement in the water quality. The largest improvement could be seen in the formerly hypertrophic Basin 1.

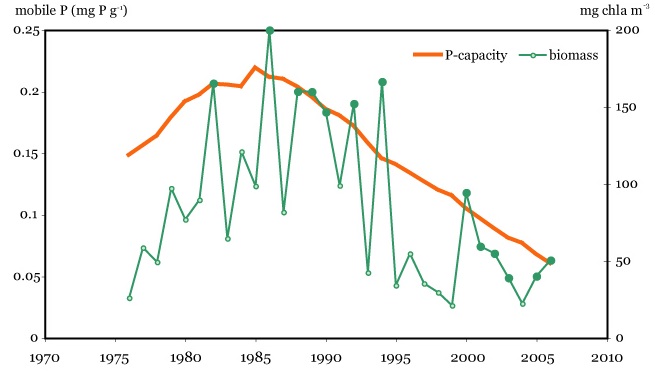
Long-term changes in algal biomass were more closely related to the mobile P content of the sediments than to the instantaneous external P load. Fast immobilization of the mobile P pool in the highly calcareous sediments of Lake Balaton (carbonates make up 50-60% of dry mass) might be the principal factor that led to the unexpectedly fast recovery in Basin 1. The mobile P content sets an upper limit to the internal P load that, in turn, determines the carrying capacity of Lake Balaton. This capacity has not been filled in years when other environmental conditions (water temperature, physical stability) were unfavourable for cyanobacterial growth.

Upon realistic levels of further load reduction, the following water quality targets could be achieved by 2025:
| Ecological targets | Permissible TP load | Load reduction | ||||||
|---|---|---|---|---|---|---|---|---|
| Phytoplankton | Chironomidae | tons P yr-1 | % | |||||
| Annual MB | Q index | Maximum MB | Ch. balatonicus | |||||
| mg chl a m | Value | Classifi-cation | g dry mass m | ind m | Classifi-cation | |||
| Basin 1 | 14 | 6-8 | good | 2.0 | 800 | good | 37 | 17 |
| Basin 2 | 12 | 6-8 | good | 1.5 | 500 | good | 21 | 54 |
| Basin 3 | 8 | 8-10 | excellent | 0.5 | <1 | excellent | 17 | 34 |
| Basin 4 | 6 | 8-10 | excellent | 0.5 | <1 | excellent | 22 | 24 |
To achieve these targets, we must further reduce nutrient loads. This is a challenging task since upon improved sewage treatment, two thirds of the loads originate from non-point sources. Efficient management is impossible without carefully watching the response of the lake. Our monitoring program is a part of the lake observatory system.